The Secret Language of Comics: Visual Thinking and Writing

Reflection Post: Literacy Narrative Comic

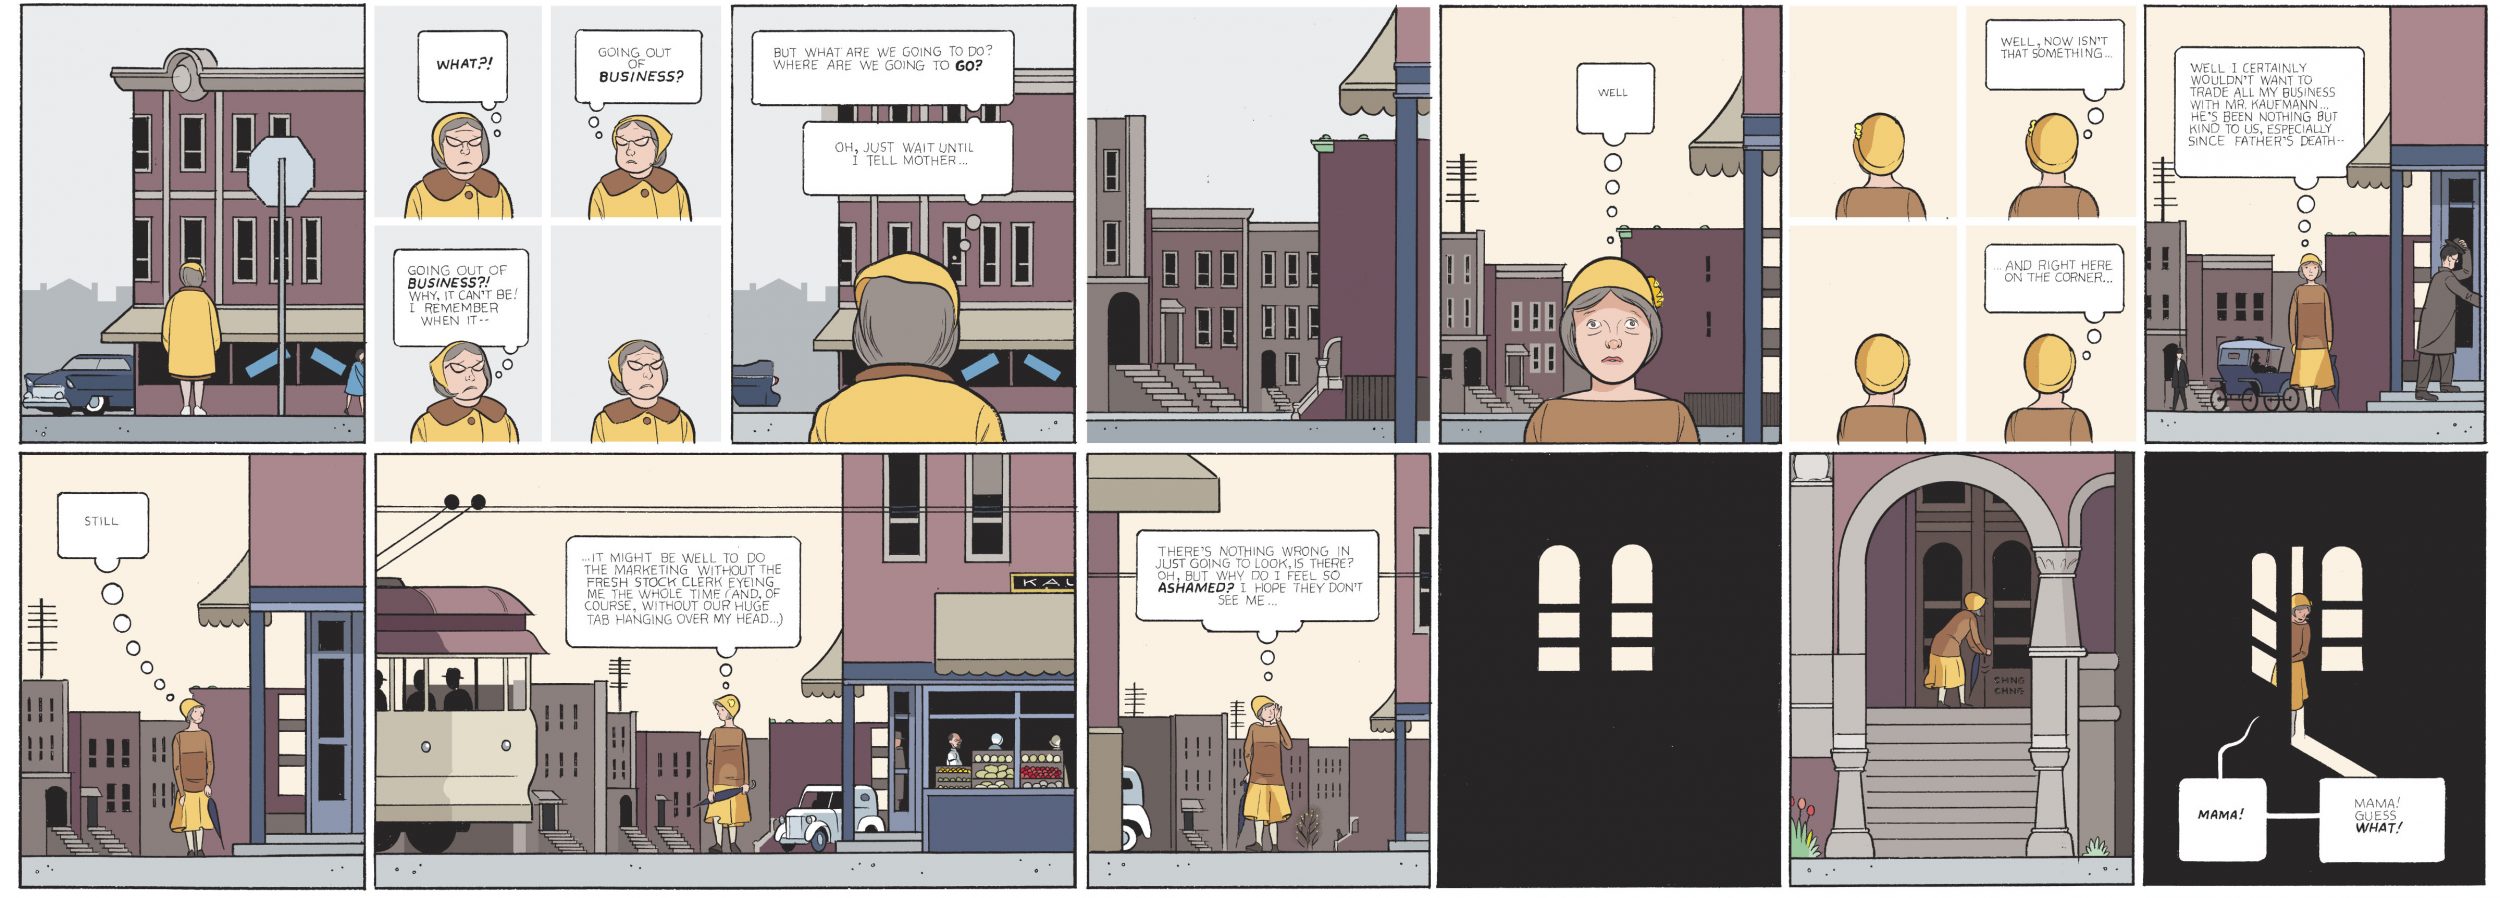
My comic is an autobiography that highlights the major changes in my life that influenced and defined my reading and writing habits. In this comic, I wanted to clearly convey how my experiences with reading and writing drastically changed as a result of the change of environments within my life. To do so, I adopted more of a traditional narrative style where the narrator, which is myself, tells the story with the aid of the images in the panels. Due to this, one may notice that there is very little dialogue between the characters depicted in the comic but rather the story is carried along by the text either found below or above the images—the voice of the narrator. 

As mentioned previously, in this comic I attempted to highlight the change in my attitude and outlook on reading and writing due to various experiences within my life. I believe that this emphasis was much more present in my visual comic than in my original alphabetic text. Once the visual aspect was added, it allowed for easier story-telling and the role of envisioning now fell on myself as the illustrator rather than the reader. As the illustrator, I was now suddenly forced to think about what I want the reader to see and then place that on the page as a drawing to the best of my ability. Not only that, but my thinking process was different as well as I started to invest more thought into what I specifically wanted to say and show rather than the general story that I originally gave in my alphabetic text. The transformation of my literacy narrative from plain alphabetic text to a comic filled with images as well as text gave rise to an extra layer of depth and content which ultimately bettered the story in my opinion. 

Creating this literacy narrative comic allowed for the use of various modes of composing text, namely written, visual, and digital. Because of this, I was forced to step outside of my comfort zone to be able to utilize these differing techniques in writing. Additionally, various techniques and ideas seen in comics which we have read this semester have been used in my comic. For example, the varying perspectives seen in my comic was inspired by panels seen in Stitches and Spinning. This comic also had several different versions which took multiple drafts and rereading to finish showing its process of creation, and critique received from others was also taken into consideration. Lastly, as shown throughout my comic, visual thinking strategies were used as I created each panel. I constantly questioned whether the images and text in each panel properly served its purpose and flowed into the next panel. 

The creation of my Literacy Narrative Comic came around in a rather difficult manner. This is mainly because of the time I spent on the visual aspect of the comic. After drawing each panel out to the point where I wanted it, I went back to detail and shade each image to give it more of an effect when the reader views it. Still, my ideal vision for my comic could not be realized due to time constraints as well as a lack of skill on my part. If I was given more time and a professional illustrator, I would have liked to make the visuals less cartoon-like in order to correspond with the slow and semi-serious tone I was trying to accomplish with the narration. Additionally, I would have included a couple more pages to get even more detailed into how exactly my reading and writing habits changed due to moving.
A Reflection About A Poem About Poetry

I really enjoyed creating this comic because it allowed me to illustrate a story very personal to the way I write today. By depicting the overall concept of my Literacy Narrative 1, I was able to look at it from another perspective that to me was more engaging. In my Literacy Narrative 2, A Poem About Poetry, I look at my journey from not writing anything and disliking my English assignments to sharing my poetry on public platforms. The feedback that I got on our rough draft day was very positive and helpful in creating my final draft. My peers suggested that I really bring the imagery to life as well as find a way to enhance the flow of the comic.

On page 2 I have the phrase “beautiful poetry” going into the characters ear from outside the panel. This panel signified how I would watch poetry but never to write it. I decided to bridge the panels together by creating a loop. On page 3, in the last panel I’m the one creating the “beautiful poetry” that will hopefully be going to people’s ears.

Literacy Narrative Reflection

This week I submitted my final Literacy Narrative comic. Last week, during peer review, I received comments telling me to focus more on the dichotomy between Math and English. As a result, I changed my final page to include an award in English, revealing how I overcame my struggles in English class. I also received feedback telling me to utilize the frames to depict sudden changes in mood and tone. As a result I included panels that were zoomed in on characters faces.

How Satisfied Am I With Myself?

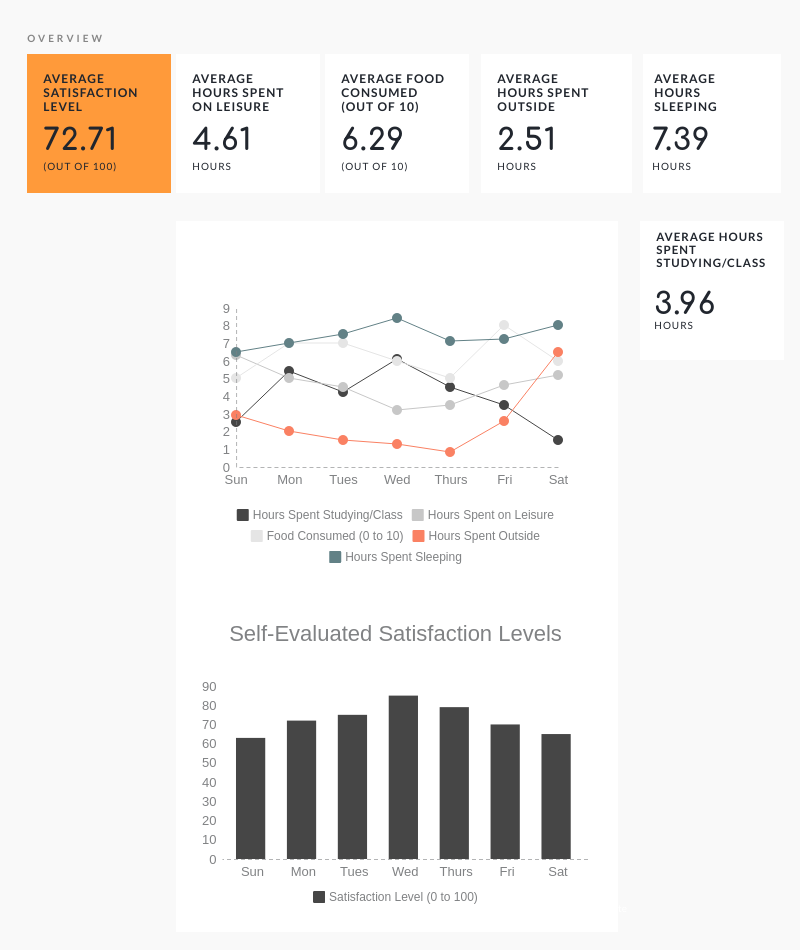
For a week, I tracked various categories that I believe ultimately play a factor in my amount of satisfaction with myself at the end of the day. These categories covered various areas throughout my day such as my work, food intake, leisure, and sleep. While there are many aspects of the day, sometimes very specific aspects, that can affect my satisfaction with myself at the end of the day, these categories were chosen to give a more general outlook at how my satisfaction is affected by my overall day. By doing so, I can analyze the data and draw out possible connections between my satisfaction and the various categories.

I decided to use a line graph to represent the categories as it’s simple way to view multiple data set and easily point out interesting patterns, similarities, or differences, between the data. According to the visualization, I feel more satisfied with myself generally when I have spent more time doing work or studying and less time on leisure, or time outside. As expected, my satisfaction levels correspond directly with the amount of work that I am able to get done and somewhat indirectly with leisurely activities. Another interesting observation is that my satisfaction levels also seemed to correspond to the amount of sleep that I got. The more time I spent sleeping, the more I feel satisfied at the end of the day.

I’m confident that if I was to continue this project as it is into the future, the results will more or less stay the same. In order to look more in depth, I would try to find a way to observe more specific aspects of my life and how they affect my satisfaction. This project is indeed a valuable tool for self analysis as it allows one to be able to draw conclusions not solely based off of one’s opinions of themselves but rather by their actual behavior and habits.

Trinity in English 2019-11-11 03:20:49

Question: Does my external self or internal self dictate my level of confidence?

To answer my question, I chose to track my level of satisfaction with both aspects of myself. I directly recorded this information in a journal, rating each category on a scale from 1-10 (10 being highest satisfaction). For quantifying satisfaction with my physical self, I considered the following: how much I liked my outfit for that day, how I felt about my skin, how much time and effort I put into caring for my physical well-being. For tracking satisfaction with my productivity I paid attention to the following: time spent doing activities I enjoy (writing, dancing), level of focus/energy put said activities, and improvement. I chose to draw bar graphs as my visualization because it was easiest for me to understand. I’m not great with graphs and I’m especially tired of excel right now (blame bio lab). Hand drawing a qualitative graph with colored pencils kept this week’s Sunday Sketch feeling more artistic than analytical.

I expected to see direct proportionality between one category and my level of confidence for the day when analyzing my data. That’s not what I found. Instead, my level of confidence regularly split the difference between appearance and performance. So, the data answered my question indirectly; I receive confidence from difference inputs – where one aspect of my life wains in satisfaction, another can support my self-esteem. Overall, the outcome of this exercise served as a testament to balance – not placing too much stock in one aspect of life. Two data points did not demonstrate a balance between external and internal satisfaction: Saturday and Sunday’s confidence levels. One aspect was especially low on each of these days. These low-rated aspects seem to weigh down my overall confidence.

Who Has My Best Interest?

Visual Representation of Data

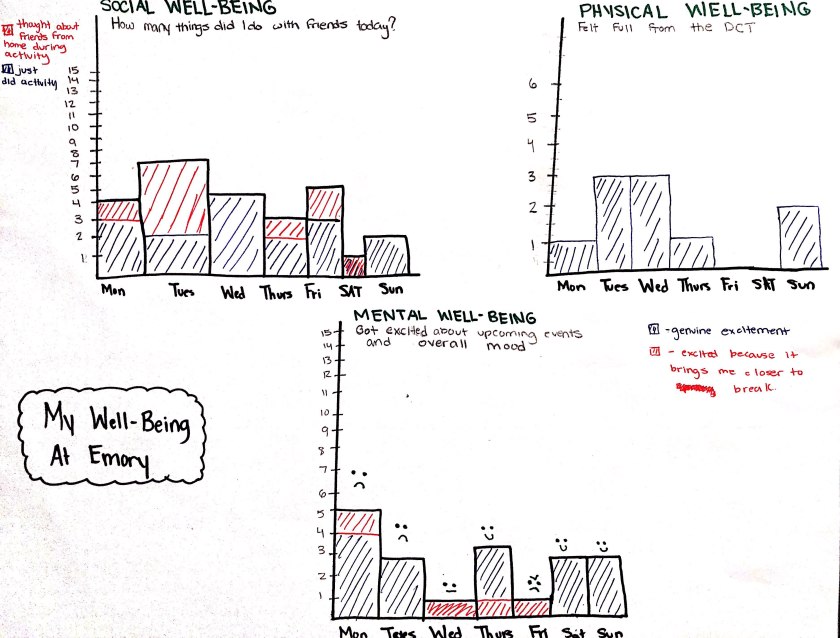
A question that always runs through my mind is the exact question I tracked for the week for this post: Is Emory treating me well? I never thought I would end up here so when I did I was kind of surprised myself so this was just a test to see if I really do belong here. I decided to test my social life, what I thought about throughout the week, and how full I felt each day from the food Emory provides to me. Only for the first two I noted if it was connected to me wanting to go home or was it a feeling or action that the school and my surroundings genuinely brought to me.

In conclusion I could say that Emory is doing its best and I am not miserable here and don’t think about home 24/7. Socially I am thriving and there are things set up throughout the calendar that I am interested in and looking forward to. The hardest thing about this for me was tracking my thoughts for the mental aspect and seeing if I was really excited, fake excited, or not excited at all and it was just a blank thought. I enjoyed this experiment thought because it has reassured my place here at Emory.

Fire in your Eyes

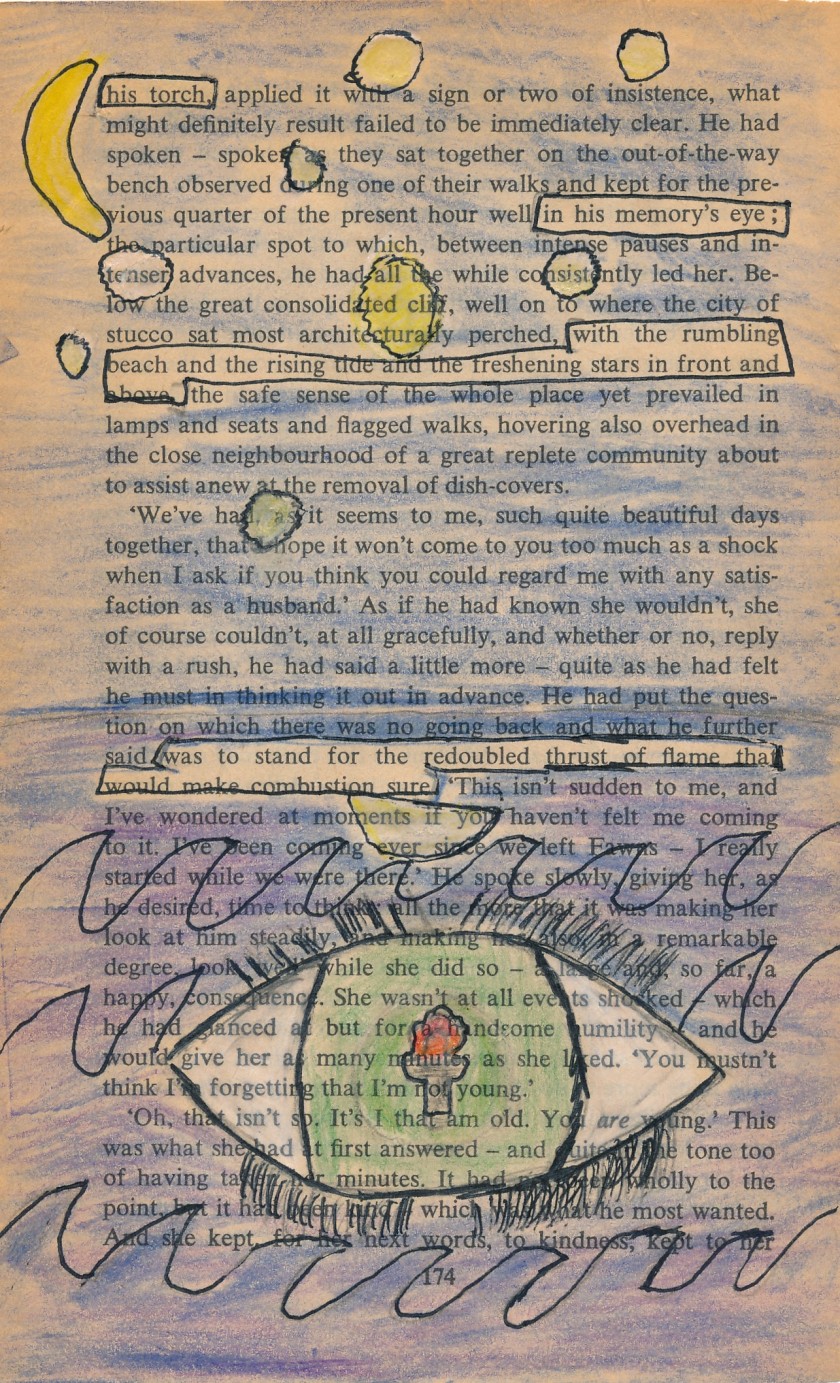
his torch

in his memory’s eye

with the rumbling beach and the rising tide and the freshening stars in front and above

was to stand for the redoubled thrust of flame and would make combustion sure

This assignment at first seemed like a daunting task because I had to make my own story out of a set of predetermined sentences; however once I decided to look past that and just allow myself to be free with my drawing and poem it turned out to be a therapeutic event in the midst of hardcore studying and testing.

Link back to this assignment: https://eng181f19.davidmorgen.org/assignments/sketches/sketch-8-human-document/

How Great is my Life Going?

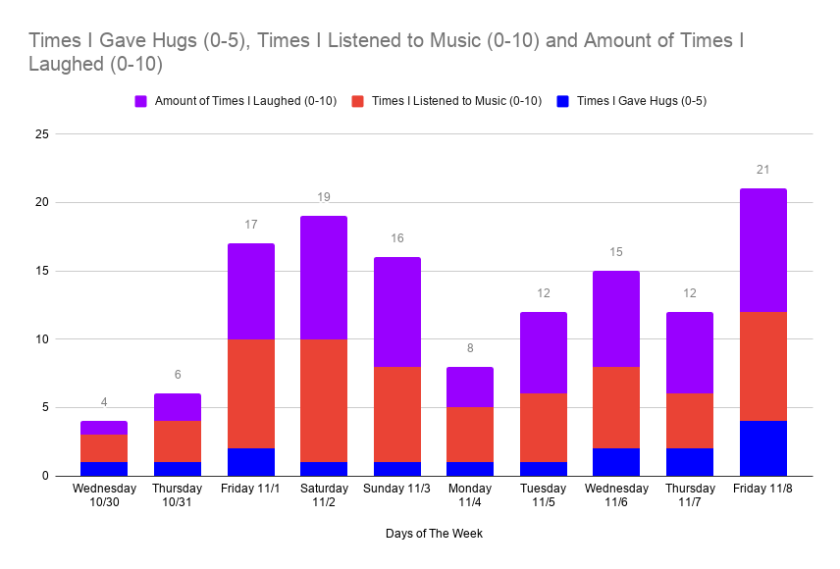
Days with Score Above 15: Very Good Day
Days with Score Between 8-15 : Average Day
Days With Score Less than 8: Bad Day

I wanted to track the amount of times that I was performing actions that gave me a sense of comfort. These actions were to be indicative of how well the course of my week was going. Every time I would have a low count day I noticed that it was correlated to events that were making me stressed out and/or anxious. I noticed right away that the more fun or less stressed out I was, the “happier” I perceived my day to be going. I also noticed that although I wasn’t having any problems on Monday I had a low score simply for the fact that the “Monday” energy was hitting me. My “weekend” days Friday- Sunday were notably higher because I knew that I wouldn’t have to be concerned with quizzes, tests, or work.

If I were to continue this project I would have looked to make sure that even if I had personal issues during the week, I would not let them impact my mood for the day. I found this tool to be valuable for me because generally I think that most of my days are pretty terrible but being able to quantify my day with numbers helped me see that my days weren’t as bleak as I had originally anticipated. Being able to see my life as a set of bars on a graph helped me to see that I am capable of controlling how to navigate my issues, and not let them have as big of an impact on my life or of those around me.

Assignment Link: https://eng181f19.davidmorgen.org/assignments/sketches/sketch-9-data-viz-from-everyday-life/

The Happier, The Better?

Is it always true that better moods can lead to relatively higher productivity? My data says “no!” 

For the past two weeks, I’ve been tracking the correlation between my mood and the level of my productivity. In order to be more precise on my data, I decided to focus only on my productivity when studying, which includes my time spent doing homework, group projects, class registration, advising, and all things that contribute to my overall academic progress. I chose to record the total time I spent studying, the actual time I studied, my time of highly focusing on my work, and the time I didn’t study (including looking at my phone, chatting with my friends, eating snacks, etc.) within the total studying time range. Tracking my mood was, however, comparatively harder because it is a more feeling-based rating rather than solid data. Therefore, I chose to give a numerical measurement to the abstract feeling by dividing my mood into different levels:

  • Level 1: Negative (e.g. upset, angry)
  • Level 5-6: Neutral (e.g. calm)
  • Level 10: Positive (e.g. happy, excited)

I then rated my mood at the beginning of every one of my tasks, and I averaged the ratings by the end of each day as my general mood when studying. 

When I first started this project, I expected my productivity to be the highest when I was in the best mood. However, looking at my final graph, I surprisingly found that when I was particularly happy and excited, my productivity turned out to be low. This result can be observed through my data for Friday when I was so thrilled about the weekend that I ended up spending half of my time chatting with my friends when doing homework. In contrast, my productivity was the highest when my mood level was around 6-7, which was a neutral and slightly good mood. From the graph, we can see that high productivity is achieved when the red bar (actual time spent studying) is significantly longer than the yellow bar (time not studying), and this only occurs when my mood was neutral (6-7). Other than that, I also found that being in a neutral mood helped increase my concentration. It is important to note that here I’m comparing the percentages of my time of highly focused (“time of highly focused” divided by “total time spent studying”) between different days, rather than comparing the actual hours of highly focusing time because the total studying time varies from day to day.

Presenting my data in a visual graph was time-consuming. I used to record my daily data in a hand-drawn spreadsheet and was about to do so for my final version of the assignment. However, since I have never tried using digital software to create charts before, I decided to give it a shot. After hours of struggling, I managed to create a visual chart on Infogram.com. The visual chart is certainly a valuable tool since it visualizes my study habit and relates it directly to the level of my mood. I’m definitely inspired by the data to calm myself down before I dive into my work in order to achieve the highest of my productivity, and I should probably avoid studying when I’m thrilled.

What am I busy with?

sk9

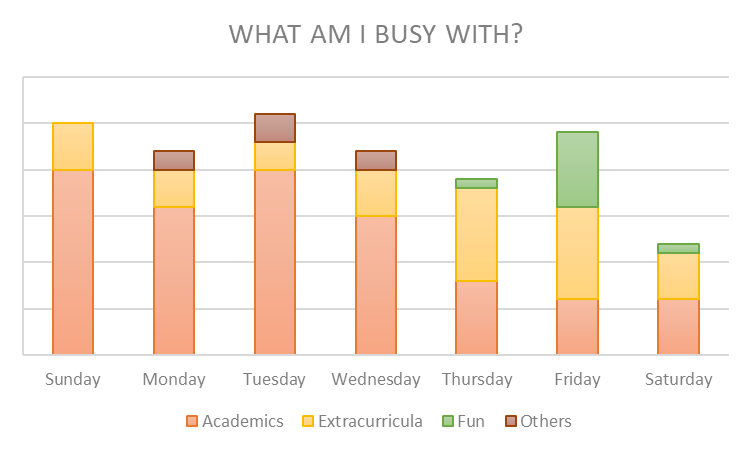
I developed this habit of listing pending matters at the beginning of this semester after a terrible week haunted by time conflicts. To avoid over-scheduling myself as well as procrastination, I write down my everyday work on a notebook for better time management. This sketch assignment makes me realize that the notebook can also be used to trace back my daily life and identify potential patterns. Although I do not put down everything in my life, items on the notebook are usually things that occupy most of my time when I am not in class. This graph represents data from Sep. 23rd to Nov. 10th.

My Sunday to Monday is mostly occupied by academics and less time is spent studying since Wednesday because I tend to finish assignments ahead of time so that I can enjoy the rest of my free time without thinking about dues. Most of my extracurricula are scheduled on Thursday night and Friday because I do not have classes on Friday. The drop between Friday and Saturday is easy to understand – Friday nights never end on Friday.

I have thought about showing the percentage of each category, but the different amounts of free time I have make it more reasonable to record the actual numbers. For instance, my Saturday always begins in the afternoon, and I have to wake up early for classes on Tuesday and Thursday. If I were to continue this record to assess my schedule, I would use total time spent in each category instead of the number of items, since time spent on each item may range from 30 minutes to 12 hours. Except for the fact that staying up late is unhealthy, I do not see the necessity to significantly change my typical weekly schedule.


Assignment Link: https://eng181f19.davidmorgen.org/assignments/sketches/sketch-9-data-viz-from-everyday-life/

css.php