Is it always true that better moods can lead to relatively higher productivity? My data says “no!”
For the past two weeks, I’ve been tracking the correlation between my mood and the level of my productivity. In order to be more precise on my data, I decided to focus only on my productivity when studying, which includes my time spent doing homework, group projects, class registration, advising, and all things that contribute to my overall academic progress. I chose to record the total time I spent studying, the actual time I studied, my time of highly focusing on my work, and the time I didn’t study (including looking at my phone, chatting with my friends, eating snacks, etc.) within the total studying time range. Tracking my mood was, however, comparatively harder because it is a more feeling-based rating rather than solid data. Therefore, I chose to give a numerical measurement to the abstract feeling by dividing my mood into different levels:
- Level 1: Negative (e.g. upset, angry)
- Level 5-6: Neutral (e.g. calm)
- Level 10: Positive (e.g. happy, excited)
I then rated my mood at the beginning of every one of my tasks, and I averaged the ratings by the end of each day as my general mood when studying.
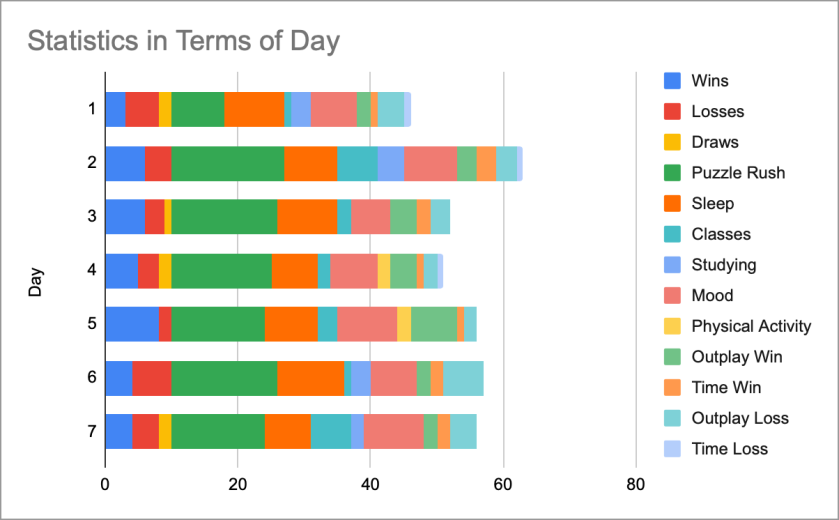
When I first started this project, I expected my productivity to be the highest when I was in the best mood. However, looking at my final graph, I surprisingly found that when I was particularly happy and excited, my productivity turned out to be low. This result can be observed through my data for Friday when I was so thrilled about the weekend that I ended up spending half of my time chatting with my friends when doing homework. In contrast, my productivity was the highest when my mood level was around 6-7, which was a neutral and slightly good mood. From the graph, we can see that high productivity is achieved when the red bar (actual time spent studying) is significantly longer than the yellow bar (time not studying), and this only occurs when my mood was neutral (6-7). Other than that, I also found that being in a neutral mood helped increase my concentration. It is important to note that here I’m comparing the percentages of my time of highly focused (“time of highly focused” divided by “total time spent studying”) between different days, rather than comparing the actual hours of highly focusing time because the total studying time varies from day to day.
Presenting my data in a visual graph was time-consuming. I used to record my daily data in a hand-drawn spreadsheet and was about to do so for my final version of the assignment. However, since I have never tried using digital software to create charts before, I decided to give it a shot. After hours of struggling, I managed to create a visual chart on Infogram.com. The visual chart is certainly a valuable tool since it visualizes my study habit and relates it directly to the level of my mood. I’m definitely inspired by the data to calm myself down before I dive into my work in order to achieve the highest of my productivity, and I should probably avoid studying when I’m thrilled.